Fe II template
A number of authors have created an Fe II template in the UV and optical range for the AGN spectra. Mainly, empirical templates are defined by the line width and the line strength, implying that relative strengths of the lines in the Fe II
multiplets are the same in all objects. From the other hand, in theoretical modeling, significant effort has been made to calculate the iron emission by including a large number of Fe II atomic levels, going to high energy and taking into account
numerous atomic transitions.
Using existing Fe II templates, we found that empirical and theoretical
models can generally fit NLSy1 Fe II lines well, but that in some cases of spectra with broader Hβ lines, the existing models did not provide a good fit, since the relative intensities of the lines in the Fe II
multiplets are not the same in all objects.
Construction of the template
To investigate the Fe II emission, we made an Fe II template taking
into account following: (a) majority of multiplets dominant in the optical part (λλ 4000-5500 Å), whose lines can be clearly identified in AGN spectra, have one of the four specific lower terms
of their transitions: P, F, S or G, and (b) beside these lines there are also lines whose origin is not well known but which presumably originate from higher levels.
We constructed an Fe II template consisting of 65 Fe II emission lines, identified as the strongest within λλ 4000-5500 Å range. 50 of them are sorted into four line groups according to the lower term of their transition (P, F, S and G). The P group consists of 15 lines, which partly overlap with Hγ (mainly multiplets 27 and 28).
The F group consists of 19 lines (mainly multiplets 37 and 38) and dominates in the blue shelf of the iron template (4400-4700 Å). The S group consists of 5 lines (multiplets 41, 42 and 43) and describes the Fe II
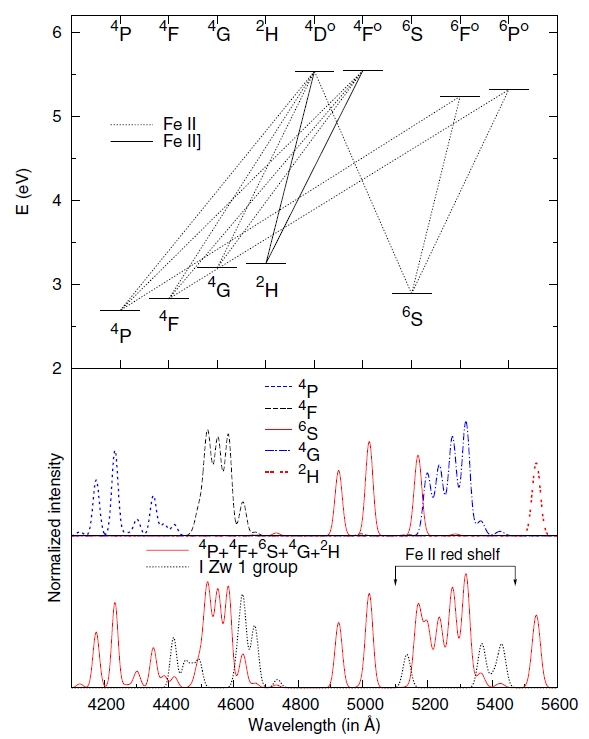
emission covering the [O III] and Hβ region of the spectrum and some of emission from the red Fe II bump (5150-5400 Å), and the G lines (11 lines from multiplets 48 and 49) dominate in the red bump (5150-5400 Å) (see Figs 1, 2).
Figure 1. The multiplets of optical Fe II lines in spectrum of object Ark 564 (Shapovalova et al. 2012, ApJS..202...10S, (arXiv:1207.1782)).
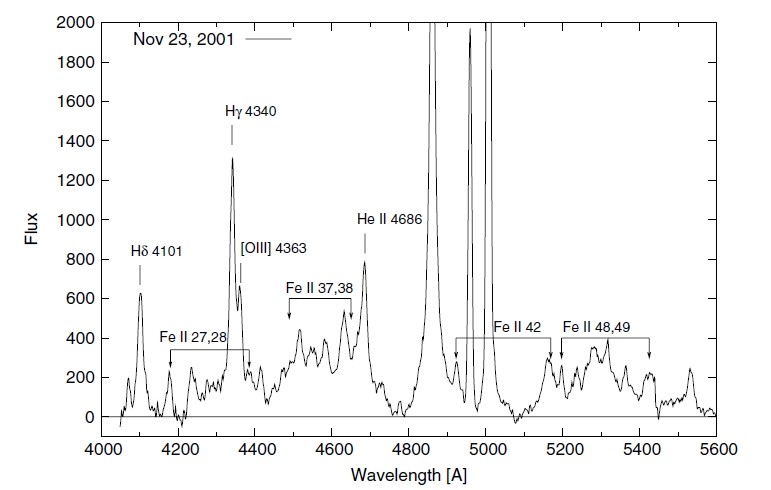
Figure 2. The Simplified Grotrian diagram showing the strongest Fe II transitions
in the λλ 4000-5500 Å region (top). Lines are separated into five groups according
to the lower level of transition (middle). Bottom: the lines from
the five line groups (solid line) and an additional line taken from I Zw 1, represented with dots.
Template parameters
We assume that the profiles of each of lines can be represented by a Gaussian, described by width (W), shift (d) and intensity (I). Since all Fe II lines from the template probably originate in the same region, with the same kinematical properties, values of d and W are assumed to be the same for all Fe II lines in the case of one AGN. Since the population of the lower term is influenced by transition probabilities and excitation temperature, we assumed that the relative intensities between lines within a line group (P, F, S or G) can be obtained approximately from:
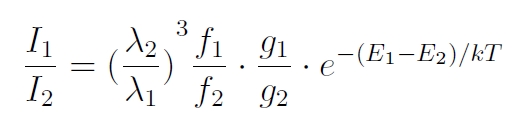
where I1 and I2 are the intensities of lines with the same lower term, λ1 and λ2 are the wavelengths of the transition, g1 and g2 are the statistical weights for the upper
energy levels, f1 and f2 are the oscillator strengths, E1 and E2 are the energies of the upper levels of transitions, k is the Boltzman constant, and T is the excitation temperature.
(Details can be found in: Appendix C in paper Kovačević, et. al, 2010, ApJS..189...15K, (arXiv:1004.2212))
Lines from the three above mentioned groups explain about 85% of the Fe II emission in the observed range (4000-5500 Å), but about 15% of Fe II emission cannot be explained with permitted lines for which the excitation energies are close to the
lines of the four groups. The missing Fe II emission is around ~4450 Å, ~4630 Å, ~5130 Å and ~5370 Å.
There are some indications that fluorescence processes may have a role in producing some Fe II lines. Namely, they could supply enough energy to excite the Fe II lines
with high energy of excitation, which could be one of the explanation for emission within these wavelength regions.
To complete the template for approximately of 15% missing Fe II flux, we selected 15 lines from the
Kurutz
database with wavelengths close to those of the extra emission, upper level excitation energies of up to ~13 eV, and strong oscillator strengths. We measured their
relative intensities in I Zw 1 which has a well-studied spectrum spectrum with strong and narrow Fe II lines. Relative intensities of these 15 lines were obtained by making the best fit of the I Zw 1 spectrum with the Fe II lines from
the P, F, S, and G line groups. The extra lines are represented in Figure 2 (bottom), with a dotted line.
Finally, our template of Fe II is described by 8 free fitting parameters: width, shift, five parameters of intensity (for the P, F, S and G line groups and for the lines with relative intensities obtained from I Zw 1). The eighth parameter is the excitation temperature included in the calculation of relative intensities within P, F, S and G line groups.
To see the tables with transition properties, atomic data and relative intensities of the lines within the groups, go to: §2.2 The Fe II template, Tables 1, 2, Kovačević, et. al, 2010, ApJS..189...15K, (arXiv:1004.2212)